Get exclusive reports and access to key insights on airdrops, NFTs, and more! Subscribe now to Alpha Reports and up your game!
Go to Alpha Reports
Solana (SOL), the world’s fifth-largest cryptocurrency by market capitalization, has experienced a significant price surge in the last 24 hours, becoming the fifth-best performer in the top 100 cryptocurrencies by market cap.
The cryptocurrency spiked by 6.6% within an hour, and is up by almost 9% within the last day to a current price just below $150. This sudden upward trend follows the Thursday morning announcement of VanEck’s filing for a Solana ETF.
As Decrypt reported, VanEck, a prominent New York-based investment management firm known for its exchange-traded fund (ETF) products, filed an S-1 registration statement on Thursday for its “VanEck Solana Trust.” This move marks the first public attempt to launch a spot Solana (SOL) ETF in the United States.
The firm, which already offers a spot Bitcoin ETF and an Ethereum futures ETF, recently filed an 8-A form for a spot Ethereum ETF. This development comes after the Securities and Exchange Commission (SEC) gave initial approvals for such Ethereum funds, leading to speculation among analysts about the next suitable crypto asset for an ETF. Many experts suggested that a Solana ETF was a likely next step.
Even before the announcement, Solana was showing signs of a potential upward trend. Since June 24, the coin has been recovering from a brief bearish correction that saw its price drop to $123. It quickly rebounded and stabilized in a horizontal channel between $135 and $140.
Price of Solana (SOL). 1-hour candlesticks. Image: Tradingview
This stable performance switched the indicators from bearish to bullish in the intraday time frame—used by quick traders, who enter and exit positions in the same day. The post-announcement spike broke the $140 resistance of the intraday channel, offering a positive outlook for scalpers and day traders.
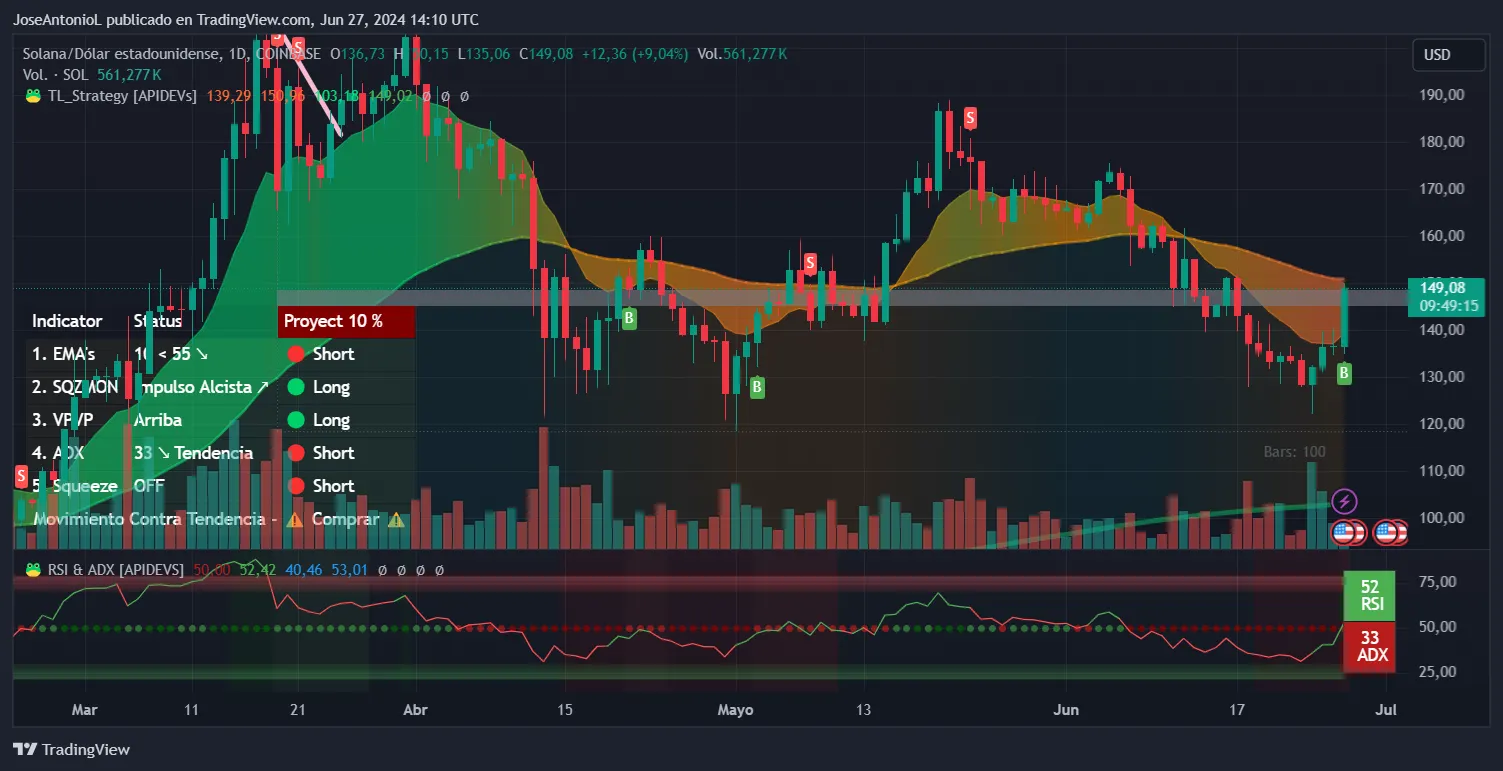
Moreover, in the 24-hour candlestick charts, the price trend moved above the EMA10 mark—that is, the average price of the last 10 days—for the first time since June 7, which could potentially encourage swing traders to consider going long as the price of SOL may be rebounding from its bearish trend.
Solana is still in a bearish correction, judging by the 24-hour candlesticks, with the EMA 55 (the average price of the last 55 days) now sitting above the EMA 10. In other words, holders need to keep their assets for longer in order to realize their gains.
However, the price has broken to the upside and is currently battling to break past the resistance set by the average price of its last 55 days, which has proven to be a strong resistance.
Price of Solana (SOL). 24 hour candlesticks. Image: Tradingview
If Solana manages to break past the resistance near $150, it would confirm a bullish bounce. This is particularly significant as the Relative Strength Index (RSI), an indicator that measures the dominance of bears or bulls, is at a nearly perfect equilibrium at 51 points. Some indicators also suggest a bullish momentum following a major bearish impulse.
If Solana maintains its bullish trend, an immediate resistance could be set near $160. However, if it fails to maintain momentum, then it could drop to around $135, near the EMA10, before either bouncing back or continuing its bearish momentum.
Edited by Andrew Hayward
Disclaimer
The views and opinions expressed by the author are for informational purposes only and do not constitute financial, investment, or other advice.
Rachel Thomas is a writer who focuses on arts, automotive, travel, and fashion. She also writes about her hobbies: cooking, reading, and playing video games.
Rachel has been a writer for Free Press Georgia since 2016. In that time she has written about everything from the best restaurants in Atlanta to how to make your own face mask at home.
When she's not writing for FPG she spends her time with her husband and two cats in their apartment.